So Atlas is what I use to follow AI, semiconductor, space and quantum stocks. I couldn’t find anything that tracked this corner of the market the way I wanted, so I built my own. It’s private; it’s just me and my friends on it.
What’s in it
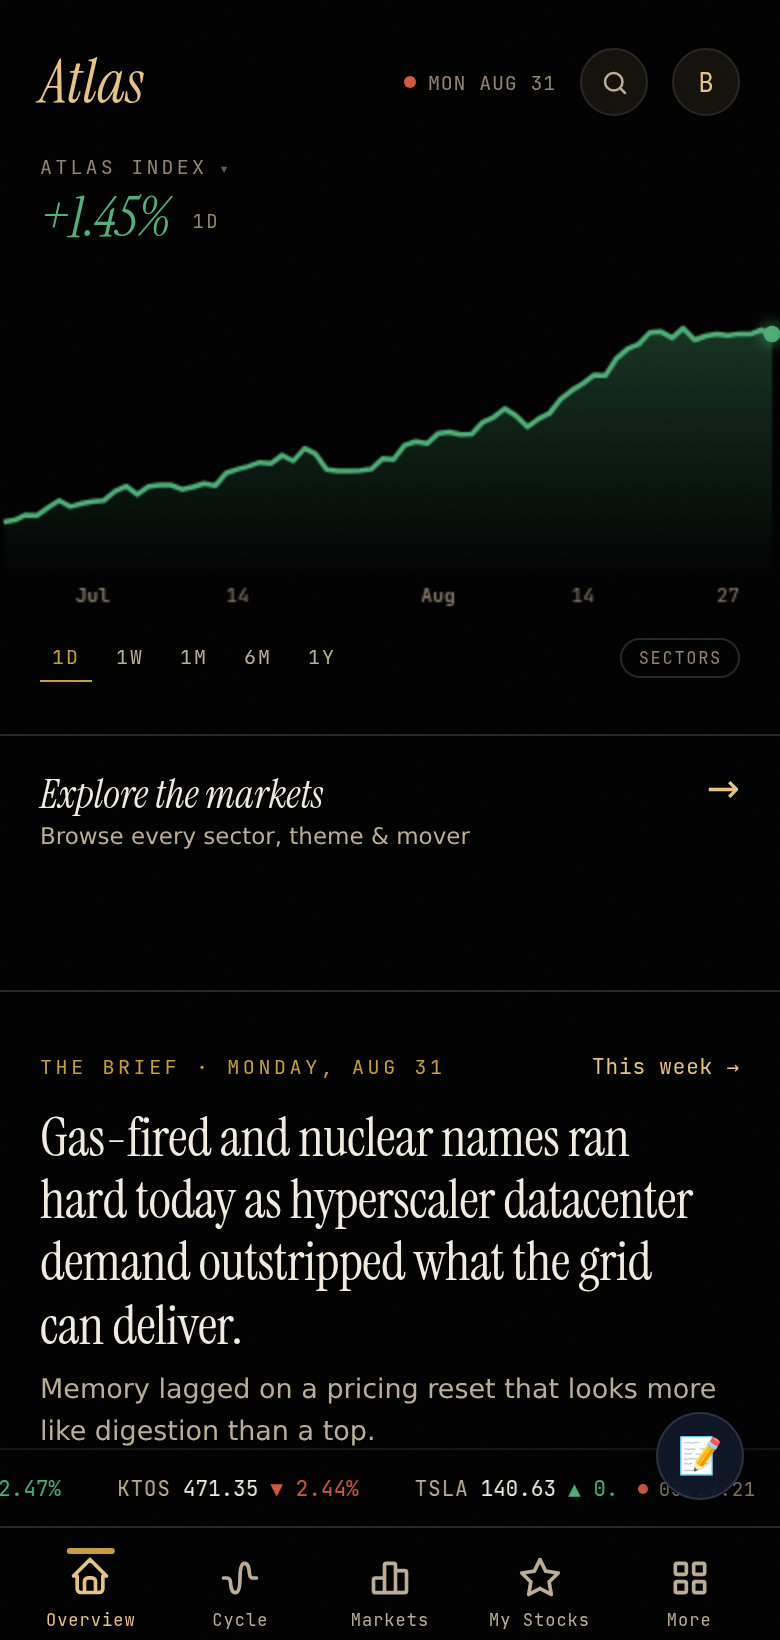
The universe. A few hundred companies across the AI hardware supply chain (basically the picks and shovels), plus the space and quantum names, sorted into sectors. Atlas keeps its own equal-weight index of the whole universe and one for each sector, so you can see on one chart whether optics or memory or whoever is actually leading the group.
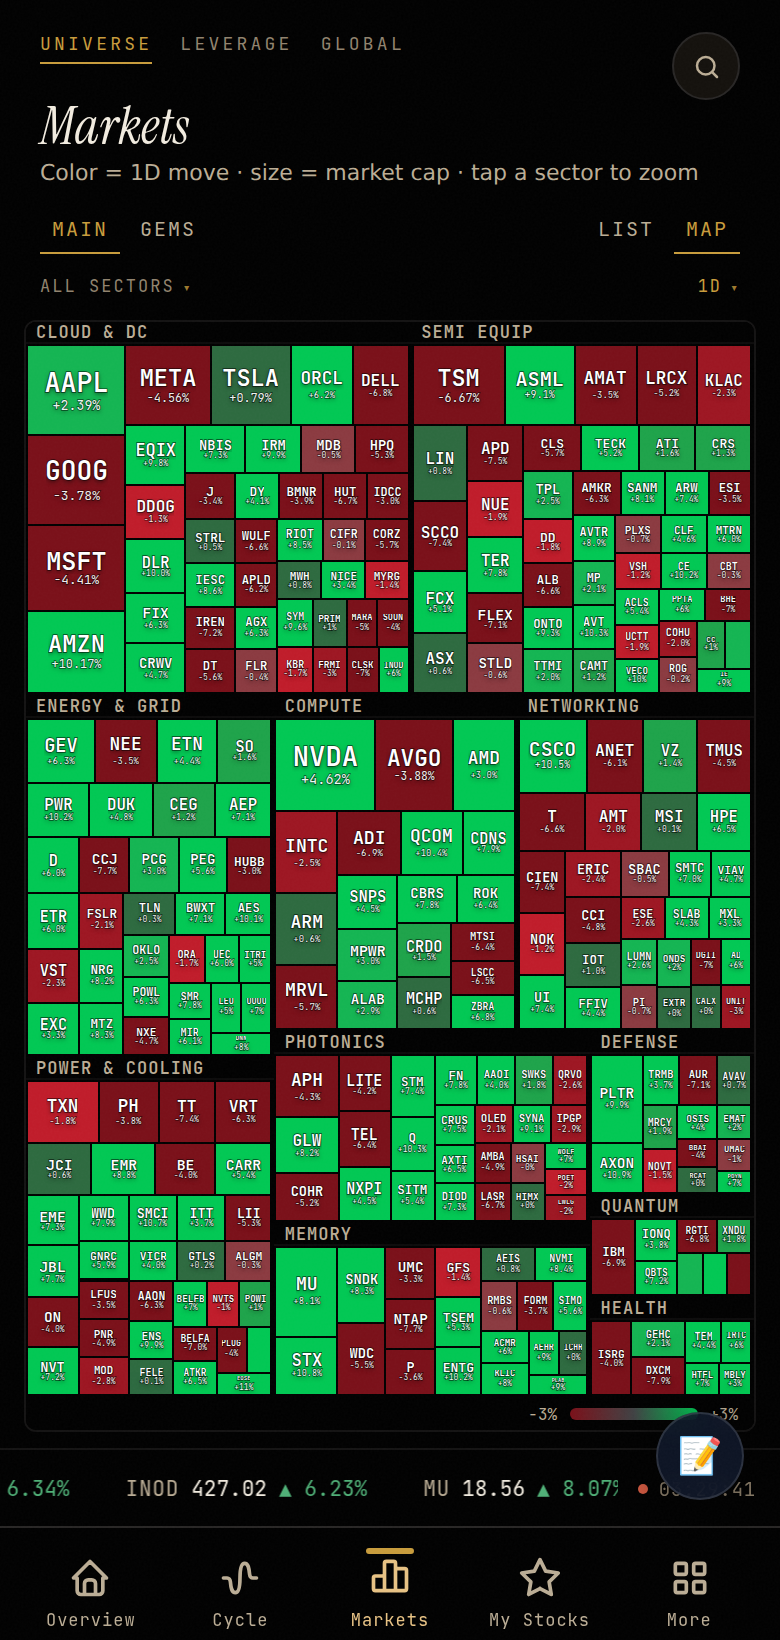
Markets. Every name as a leaderboard and as a treemap, sized by market cap and colored by the day’s move. Honestly it’s the fastest way I know to see where the money went on a given day.
Ticker pages. Each company opens into a drawer with:
- a candlestick chart with the usual indicators (moving averages, RSI, MACD, Bollinger bands, VWAP)
- earnings history: two years of call transcripts, the reported income statement for each quarter, and a search box that pulls up what management said about a topic across all of those calls
- the full option chain with computed greeks
- any leveraged ETFs that track the stock
- how much of the recent move happened overnight versus during the trading day
The Wire. A feed of the stuff that tends to show up before a move: insider buys and sells from Form 4s, 8-Ks, CEO and CFO changes, secondary offerings, unusual options activity and upcoming earnings, right next to the news for each name.
Cycle. A dashboard for where the AI hardware cycle actually stands, built from primary data instead of headlines. It scores 21 readings, including:
- corporate credit spreads, and financing filings from the GPU cloud companies
- hyperscaler capex and the order backlog at power-equipment makers
- the price and volume of AI inference, and what it costs to rent a GPU
- wholesale power prices
- US construction spending on data centers, power plants and chip fabs
- Taiwan’s monthly company revenue and export orders
- global chip sales, and US chip-industry capacity and inventories
- trade in chip-making equipment
- export-control activity from the US and from China’s commerce ministry
Each reading gets compared against its own last few years, not some outside benchmark. It only counts as turning if it’s sitting in the weakest quarter of that range and still moving the wrong way; one without the other doesn’t count. The readings are grouped too. Credit, chip-equipment orders and inference demand are the early warnings. Power and data-center buildout, chip demand and memory prices are the confirmation. Instead of mashing everything into one score, the page shows how many of the early-warning groups are turning, and flags it when data-center buildout and chip-equipment orders disagree. Export controls are their own thing (a quiet, watch or break flag), since a policy change either happens or it doesn’t.
Global and leverage desks. The foreign listings and ADRs behind the supply chain, with home-market prices where there’s no US listing, and a map of the single-stock leveraged ETFs.
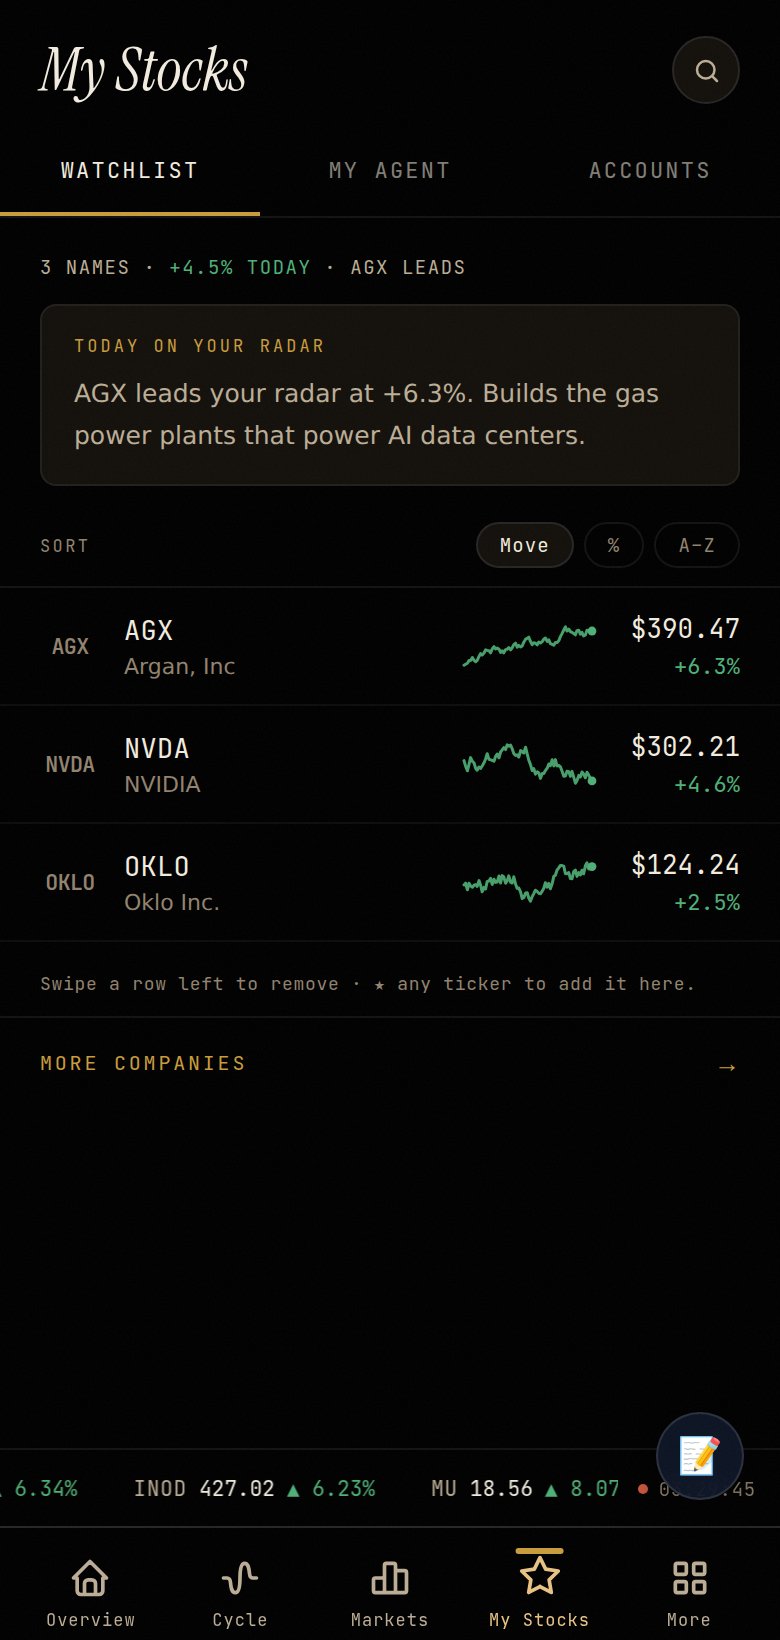
My Stocks and Calendar. A watchlist, linked brokerage accounts, and an earnings calendar for everything in the universe.
How it runs
About forty scheduled jobs pull prices, filings, options data, news and government stats, each on its own schedule (most of them every trading day), and dump it all into Postgres. Daily price history for the whole universe, about ten years deep and split-adjusted, lives in Atlas’s own database, so nothing hits a vendor every time a chart loads. A nightly job catches new stock splits and fixes the older prices so the charts don’t show fake drops.
The data rules are pretty strict. If a source comes back empty, the page shows a dash. Not an old number, and definitely not a made-up one, so a dead feed is obvious the second you look at it. When a source breaks, I swap it out instead of bolting a second pipeline on next to the broken one. And when a feature stops being useful, it gets ripped out, not left half-working.
Stack
React and Vite on Vercel, Supabase Postgres, Clerk for sign-in, and Polygon plus public exchange, SEC and government data.